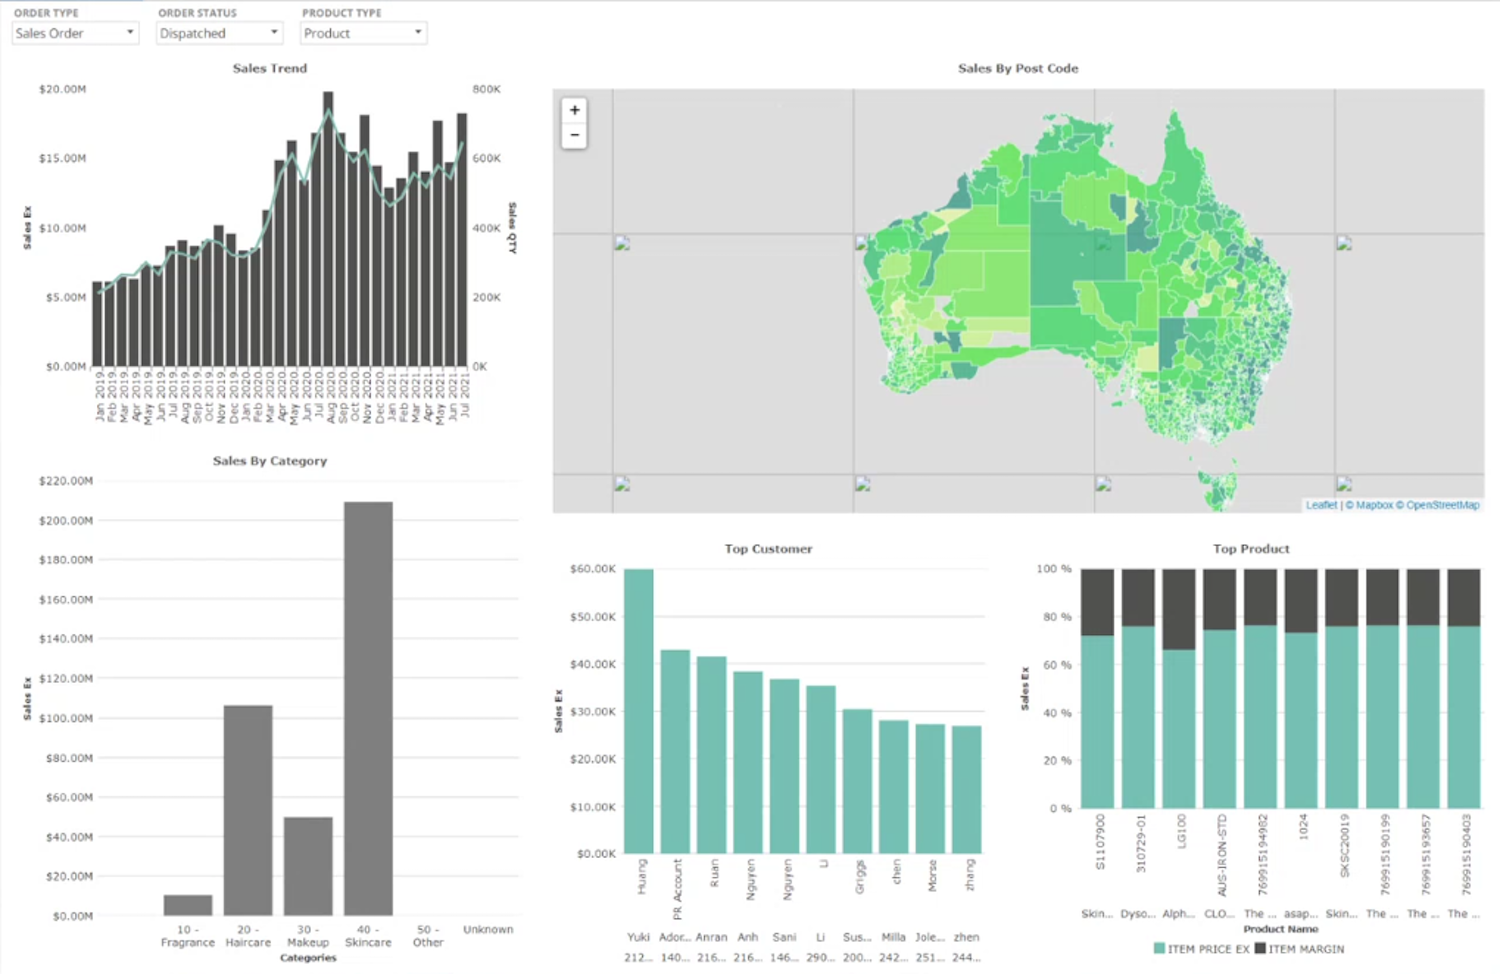
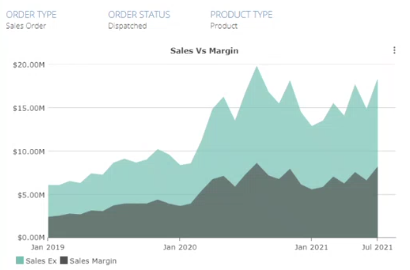
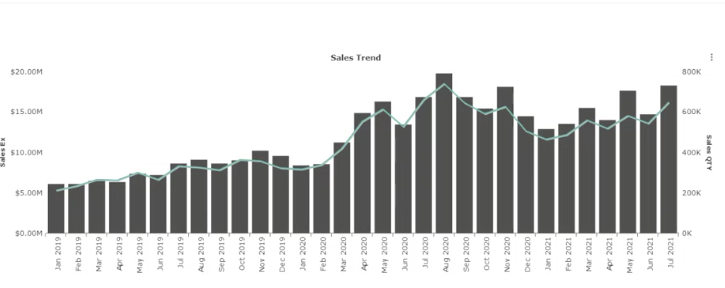
Turn data into actionable insights with our powerful business intelligence and reporting tools powered by Zap.

Our business intelligence and reporting suite offers an advanced set of tools – from interactive dashboards and reports to powerful data visualisation tools. It eliminates manual exports and automates financial processes, helping you streamline reporting and reduce risk.
It’s the ideal toolset for information management professionals who want to dissect large volumes of data with confidence to spot trends as they occur, share insights with colleagues across the organisation and understand their most profitable products.
Our suite includes a range of dashboards and data visualisation tools designed to bring all your data together to help stakeholders access accurate, structured insights across businesses departments. No more scattered spreadsheets or mismatched systems, just automated, trusted data.
Data from these tools can be used to automate reporting, make better decisions, increase profit and speed up financial close processes.
Open your door to smarter, automated business intelligence and reporting. With a single click, you can access structured data you can trust, view rich, interactive visualisations and uncover powerful business insights. No more messy exports. No more delayed reports. Save time with pre-built templates, get a visual overview of your data, and quickly spot trends and patterns as they occur.
Save time building reports
Reduce the amount of time it takes to share meaningful data stories with automated reporting and rich visualisations powered by Zap. Pre-built templates and ERP specific analytics streamline report creation, eliminating the need for manual exports and data wrangling.
Stay on top of trends with trusted data.
Discover trends occurring across your business with pre-structured, accurate insights. No more risky decisions based on incomplete or outdated data.
Action Based Dashboards, designed for you.
Achieve high-level business objectives with powerful, action-driven dashboards. Define specific KPIs across your entire production and distribution process to automate insights, track performance, and make informed business decisions.
Integrate with siloed legacy systems
Break down data silos and extend the lifespan of your legacy systems with a structured, automated data layer. Zap Data Hub bridges the gap between fragmented systems, giving end-users instant access to accurate, consolidated data.
Don’t Risk Another Decision on Bad Data
Make faster, more informed decisions with trusted insights and automated reporting, powered by Zap Data Hub.


